Summer 2026: WaterWarden’s beach water condition rankings
Which monitored beaches recorded the strongest water condition scores this summer—and which maintained favourable conditions most consistently?
For this seasonal review, using WaterWarden I compared 24 beaches and coastal areas between 1 July and 30 September 2026, using satellite observations and WaterWarden’s scoring system.
Pasha dere led the comparison, combining the highest seasonal average with the largest proportion of Good days. Kara dere and Bolata also stood out for consistency, while Camping Gradina and the Nesebar–Saint Vlas monitoring area recorded the lowest seasonal averages.
The highest seasonal scores
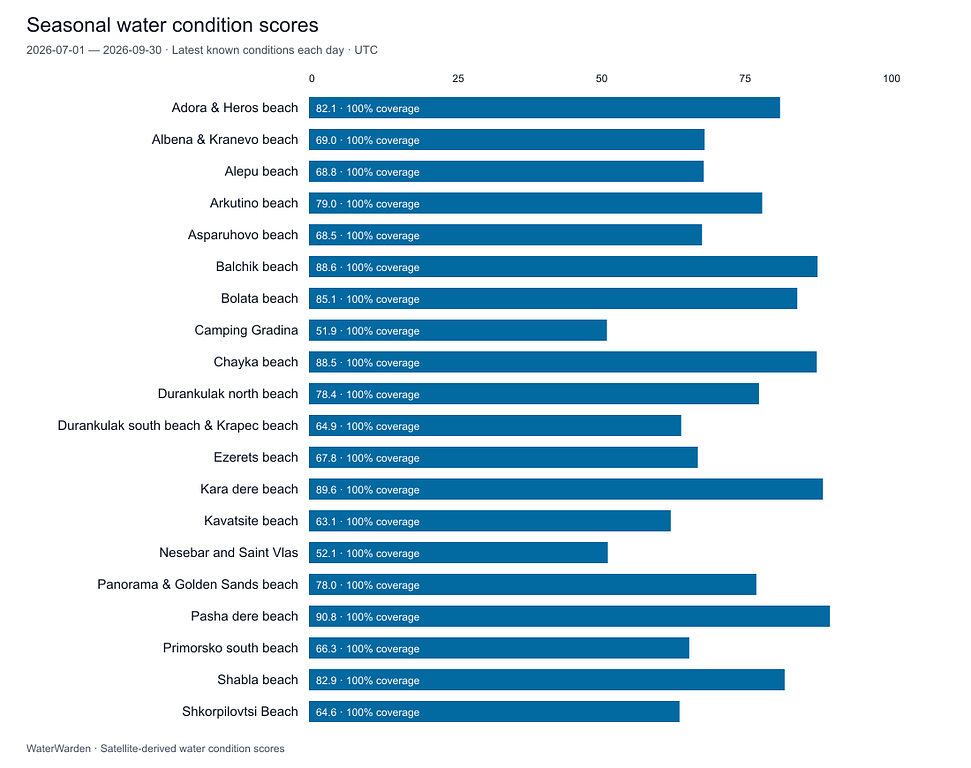
The five highest average water condition scores were: 1. Pasha dere beach — 90.8 out of 100 2. Kara dere beach — 89.6 out of 100 3. Balchik beach — 88.6 out of 100 4. Chayka beach — 88.5 out of 100 5. Bolata beach — 85.1 out of 100
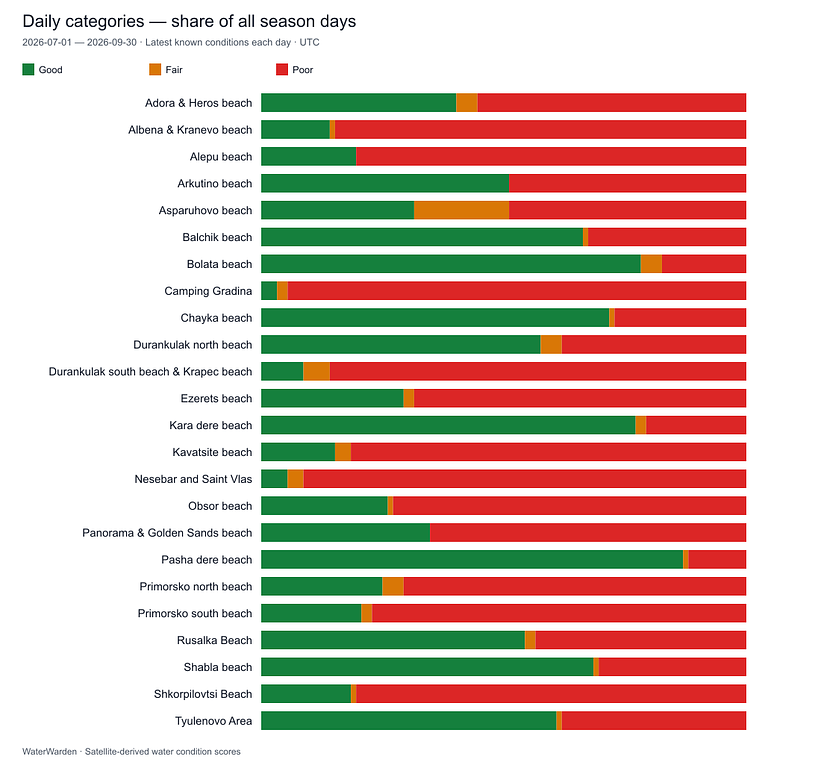
Pasha dere recorded 80 Good days out of 92, representing 87% of the season. It had 11 Poor days and one Fair day, making it the strongest performer on both average score and consistency.
Seasonal water condition scores during the 2026 summer season.
Seasonal average water condition scores. The chart shows the ten highest- and ten lowest-scoring locations, arranged alphabetically.
Consistency tells another part of the story
A seasonal average summarises overall performance, but the daily categories reveal how often conditions changed.
Bolata recorded 72 Good days, equivalent to 78.3% of the season, followed closely by Kara dere with 71 Good days, or 77.2%. Together with Pasha dere, these locations had the highest proportions of Good days.
The comparison between Bolata and Balchik illustrates why both measures matter. Balchik’s average score was higher, but it recorded 30 Poor days, compared with 16 at Bolata.
For understanding seasonal consistency, the distribution of daily categories adds information that an average alone cannot provide.
How conditions changed through the summer
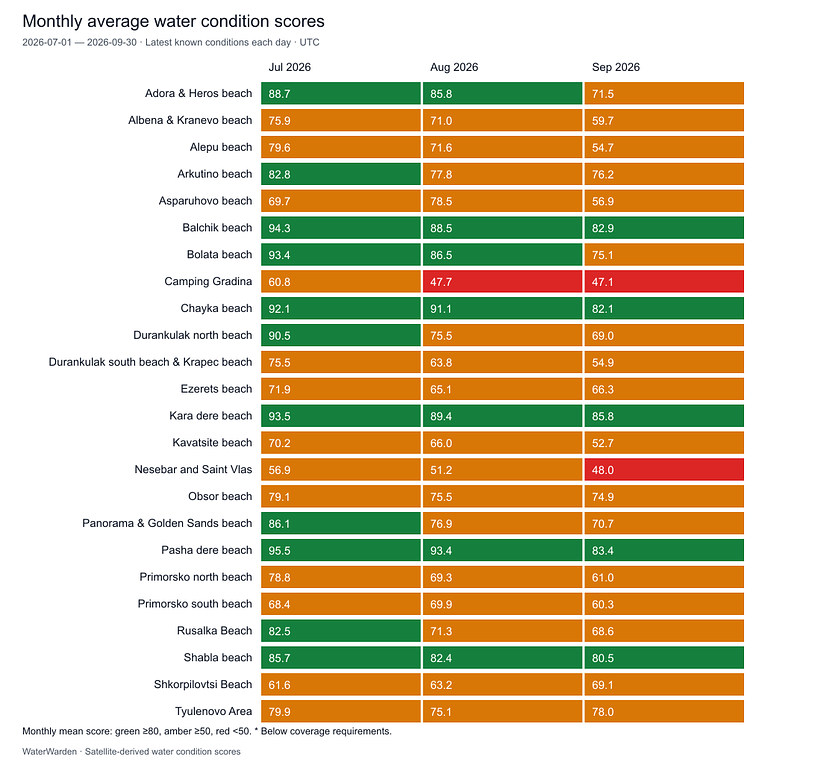
The monthly breakdown reveals a pattern that the seasonal averages alone cannot show: average water condition scores across the 24 monitored locations declined as the summer progressed.
The average across these locations was:
July: 79.7
August: 74.4
September: 67.9
Pasha dere led in July and August, with monthly averages of 95.5 and 93.4. Kara dere recorded the highest September average, at 85.8, followed by Pasha dere at 83.4.
Several strong seasonal performers also recorded lower scores towards September. Bolata declined from 93.4 in July to 75.1 in September, while Balchik moved from 94.3 to 82.9.
The pattern was not universal. Shkorpilovtsi improved from 61.6 in July to 69.1 in September, showing why individual locations deserve attention alongside the overall trend.
Across the monitored locations, average water condition scores declined as the summer progressed. This raises questions about the pressures affecting coastal waters during the tourist season, including whether wastewater collection and treatment infrastructure can cope with increased demand. Establishing the causes requires authorities to compare these observations with discharge records, treatment-plant performance and field measurements—and explain their findings publicly.
Monthly average water condition scores for all 24 monitored locations. Colours represent numerical monthly averages; the categories chart separately shows the frequency of Good, Fair and Poor days.
Categories ranking for the locations during 2026 summer season.
The proportion of Good, Fair and Poor days across the 92-day season for all 24 monitored locations.
Where favourable conditions were least frequent
Camping Gradina recorded the lowest seasonal average, at 51.9. Its daily series contained three Good days, two Fair days and 87 Poor days—94.6% of the season.
The Nesebar and Saint Vlas monitoring area averaged 52.1, with five Good days, three Fair days and 84 Poor days—91.3% of the season.
Both areas showed frequent light-attenuation and suspended-matter threshold exceedances. These repeated signals warrant a closer examination of when and where changes in water clarity occurred. Their causes cannot be established from these charts alone.
Why a high average can coexist with Poor days
WaterWarden’s numerical score combines several indicators. The daily category also responds to alert thresholds: a localized maximum above a threshold can assign a Poor category even when the composite score remains relatively high.
Balchik provides a clear example. It averaged 88.6, while 32.6% of its days were classified as Poor, predominantly alongside light-attenuation flags.
A red day can therefore reflect a localized signal within the monitored area. The ranking chart describes average performance; the categories chart shows how frequently conditions triggered the scoring system’s thresholds.
Water clarity was the dominant signal
Across the comparison, light-attenuation and suspended-matter flags were much more frequent than chlorophyll threshold flags.
The main pattern in this dataset concerns water clarity and suspended material. Investigating individual events would require comparing observation dates with local conditions and field measurements before assigning causes.
How the comparison was calculated
The analysis covers 92 daily scores for each of the 24 selected locations, using the same WaterWarden formula throughout July–September.
Inputs include satellite-derived chlorophyll-a, suspended matter, light attenuation and, where available, dissolved organic matter. Seasonal averages give each scored day equal weight. Each daily score uses the latest completed observations available for that date. Approximately 22% of location-days carried forward at least one required input, with observation ages reaching up to six days. The complete daily series therefore includes estimates between satellite observations.
Monitoring should lead to a response
These findings raise a question for municipalities and government agencies: how are repeated signals of changing water conditions being investigated and explained to the public?
I have approached public institutions with my investigations and data on multiple occasions. Too often, those approaches have ended in rejection rather than a substantive discussion of the findings, or the need for follow-up.
I know that satellite observations require careful interpretation. Institutions can question the methodology, request supporting evidence, or explain why a signal does not warrant further investigation. But disagreement should come with a reasoned response—and recurring signals deserve a clear assessment. There were many cas
I am asking for a practical process: review the evidence, compare it with existing monitoring, identify where field sampling would help, and communicate the conclusions. Where further investigation is justified, assign responsibility and act.
Public institutions do not need to agree with every independent investigation. They should be able to demonstrate how they assess credible concerns about the waters they are responsible for monitoring.
Concerns raised before incidents occurred
On several occasions, I contacted the relevant authorities about concerns identified through my investigations before incidents later occurred. From my perspective, those approaches did not lead to a clear explanation of how the concerns were assessed or what follow-up was undertaken.
I cannot establish that every incident could have been predicted or prevented, or that no action happened internally. But when concerns have been raised in advance, the public deserves a documented account of what was reviewed, what decisions were made, and whether further investigation was considered necessary.
The question is not simply whether a warning was received, but how it was assessed and what happened next and the corresponding institutions to finally do their job and keep our waters clean and safe!