The case of a Varna Bay and its water quality
Varna, the largest city on the Bulgarian Black Sea coast—often referred to as the “Sea Capital” of Bulgaria—is known for its remarkable architecture, coastal tourism, and diverse marine resources.
Within WaterWarden, we can define and monitor a custom water body by drawing a polygon over a specific geographic area. For example, after delineating the Varna Bay region, the platform automatically collects and processes satellite-derived numerical data for that exact location. Key environmental variables extracted include:
- Chlorophyll-a concentration
- TSM (Total Suspended Matter)
- Diffuse Attenuation Coefficient (Kd)
These parameters are interrelated: increases in suspended particles or nutrient-rich inputs typically influence chlorophyll levels and light penetration, altering the ecological balance of the water body.
A core feature of WaterWarden is the ability to visualize these parameters spatially and temporally, providing intuitive map-based insights.
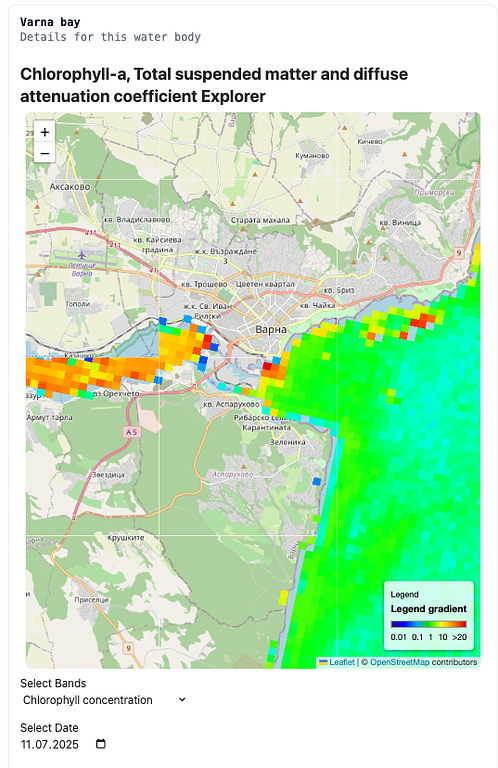
The screenshot above highlights chlorophyll-a levels across the Varna Bay area. Several localized zones display elevated concentrations. One hotspot appears within the Varna Harbour—expected due to limited circulation and anthropogenic activity. However, two additional high-chlorophyll zones were detected offshore near the “кв. Виница” (Vinitsa district). With support from local residents, we identified suspected illegal wastewater discharge points near these elevated chlorophyll concentrations.
Expectedly the TSM values also correlated with the Chlorophyll concentrations.
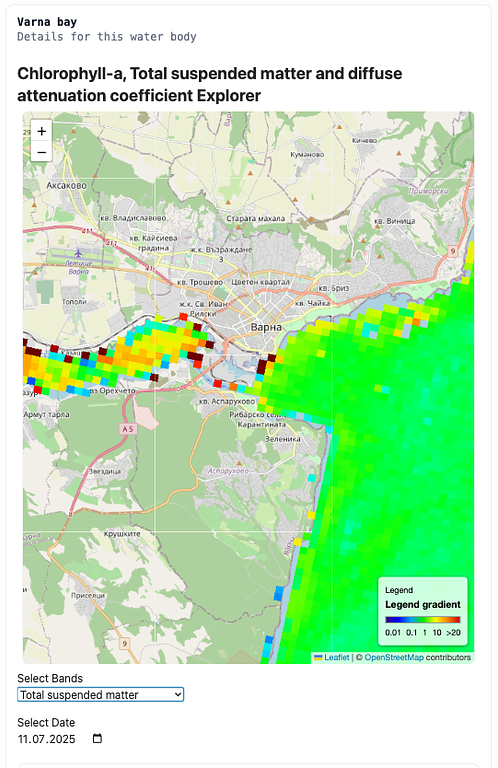
The subsequent visualization shows TSM distribution for the same date. The strong spatial correlation between suspended matter and chlorophyll suggests increased nutrient input and reduced water clarity. Under favourable conditions—particularly during summer—such circumstances may promote rapid algal proliferation and potential bloom formation.
In addition to visualization, WaterWarden includes automated email notifications designed to alert users of rising chlorophyll and TSM levels. The system also computes trophic indices, euphotic depth, and several other water quality indicators.
Furthermore, we have developed a forecasting algorithm utilizing historical satellite data, meteorological input, and environmental models to predict future chlorophyll concentrations and assess bloom risk.
If you would like to conduct a report or showcase a water body in your region, feel free to contact us at: info@water-warden.com